Toobit Adds Five Indicators to SmartK Futures Charts
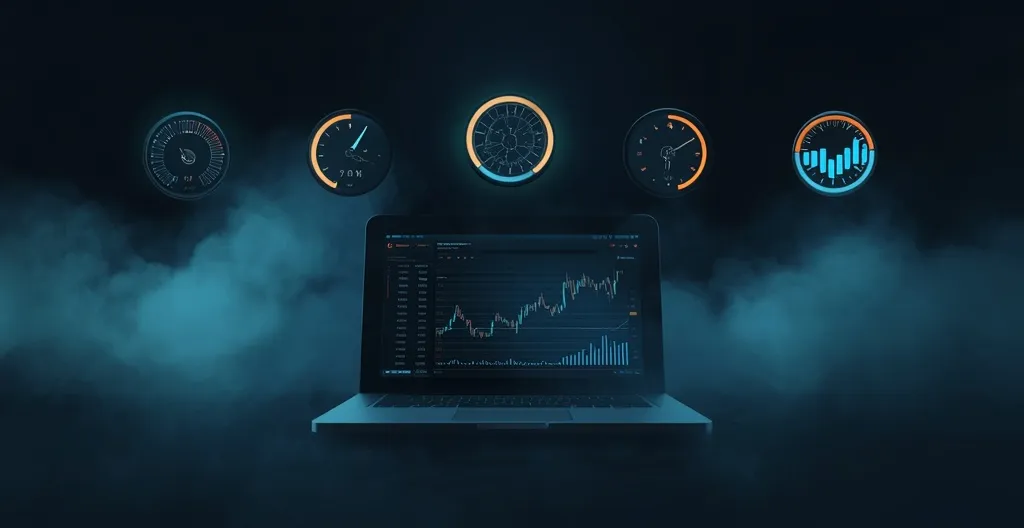
Toobit’s SmartK futures charting mode includes five indicators for reading market direction, structure, volume and momentum. Its product tutorial explains what the tools do and how to combine them, but does not give a launch date or say whether access varies by region or account.
- Five tools: three appear over the price chart, and two sit in a separate panel below it.
- Two at once: users can display one indicator from each group.
- No proven edge: Toobit provides no performance testing or independent evidence that the indicators improve trading results.
Three chart indicators, two lower-panel tools
A main-chart indicator appears over the price chart. A lower-panel indicator gets its own section underneath. SmartK lets users display one from each group at a time: M-01, M-02 or M-03 on the main chart, paired with S-01 or S-02 below.
This setup may keep a chart from getting cluttered, but using fewer indicators does not automatically lead to better analysis. The combination is a display choice, not evidence that the signals are accurate or profitable.
M-01: Trade-plan reference levels
M-01 can show reference entry, stop-loss and take-profit levels to help traders assess a potential trade plan. Toobit describes these as analytical references, not automatic trading instructions.
The product guidance does not explain how the levels are calculated. Traders should treat them as inputs to their own analysis, not as a substitute for deciding whether a trade fits their strategy and risk limits.
M-02: Entry score and market structure
M-02 combines an entry score with market-structure references, including pivots, BOS and CHoCH. In common trading usage, a break of structure (BOS) means price has broken a level considered significant to the current trend. A change of character (CHoCH) often describes a possible shift in market behavior.
Traders do not define these terms identically, and neither label predicts what price will do next. Toobit’s guide does not disclose how M-02 calculates its entry score. The indicator can also show reference entry, stop-loss and take-profit levels.
M-03: Direction across six timeframes
M-03 compares directional conditions across six consecutive timeframes around the selected chart interval. Toobit presents it as a directional filter, a way to see whether readings across timeframes align or conflict before assessing a possible setup. The guide does not specify a fixed list of intervals.
Toobit also describes a confidence reading based on historical OHLCV data and similar market patterns. The company says the reading reflects alignment among the indicator’s factors, not a win rate or the probability that a trade will make money. A confidence score is not an audited forecast.
S-01: Estimated volume-price pressure
S-01 uses historical open, high, low, close and volume data, commonly abbreviated as OHLCV, to estimate whether bullish or bearish volume-price pressure is strengthening or weakening. Related research has examined hybrid SVR-based cryptocurrency price forecasting, but a research model does not prove that SmartK’s readings are predictive.
S-01 does not show live order flow or a transaction-by-transaction record of buyers and sellers. It interprets historical candle and volume data, not who is trading at that moment.
S-02: WaveTrend momentum and divergence
S-02 uses WaveTrend to assess momentum and flag possible divergence, a mismatch between price movement and momentum. For example, price might make a lower low while momentum forms a higher low, suggesting that selling momentum could be fading.
That does not confirm a reversal. Divergence can persist, and an early signal can stay early for an uncomfortable amount of time.
Charting aids, not a trading system
Toobit’s tutorial suggests using M-03 for broader directional context, then M-02 to examine structure and possible setups. Traders can pair S-01 or S-02 with a main-chart tool to assess volume-price conditions or momentum. These are Toobit’s suggested workflows, not independently validated strategies. Traders building their own tools also debate which indicators and strategies to prioritize for crypto.
The available product guidance does not provide detailed formulas, backtests, live performance records or independent evaluations of the indicators. Traders are left without evidence that the tools improve outcomes. SmartK is best understood as a set of chart-analysis aids, not a proven forecasting system.
Reference stop-loss and take-profit levels do not remove the risks of futures trading. Leverage, fees, funding costs and slippage can all affect results. A favorable reward-to-risk ratio on a chart does not make a trade suitable or profitable.
Toobit says SmartK is available in the chart area of its Futures trading page. Its product guidance does not say whether access varies by region or account eligibility, or when the indicators first became available. Toobit was also named Global Exchange of the Year by the FinanceFeeds Awards 2026, but an industry award does not validate a trading tool’s performance.
Crypto exchanges are offering more access to derivatives. Robinhood and CME Group’s futures launch is another example. Wider access does not make leveraged products less risky.
A bullish signal does not guarantee a sustained rally, either. Dogecoin’s 2023 rally showed how quickly market momentum can shift.
Questions traders may have
-
What do the five SmartK indicators cover?
They cover trade-plan reference levels, entry scoring and market structure, multi-timeframe direction, estimated volume-price pressure, and momentum divergence.
-
Can all five appear on the chart at once?
No. SmartK allows one main-chart indicator and one lower-panel indicator at a time.
-
Does M-03’s confidence reading predict a winning trade?
No. Toobit says it reflects alignment among the indicator’s factors, not a win rate or probability of profit.
-
Has SmartK been shown to improve trading performance?
The product guidance provides no performance testing or independent evidence of improved results.