
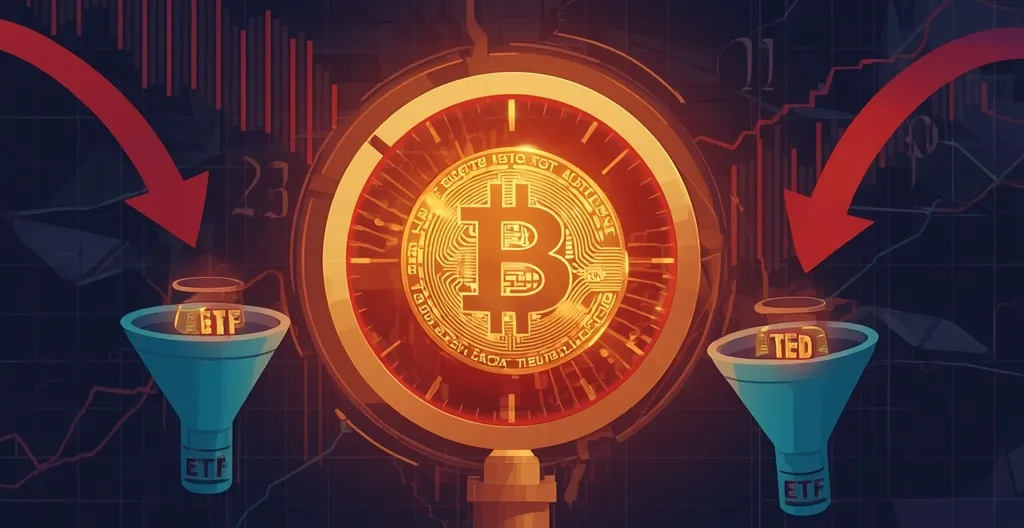
Bitcoin is sending mixed signals. Sentiment briefly jumped above 89 out of 100 into what CryptoQuant analyst Darkfost called “extreme greed, ” while U.S. spot Bitcoin ETF flows turned negative and BTC hovered near $77, 300.
- Sentiment overheated, Darkfost’s reading briefly topped 89, its highest since March 2024
- ETF demand weakened, U.S.-listed spot Bitcoin funds saw $462.7 million in net outflows
- Price stalled, Bitcoin traded around $77, 300 after a move that lost momentum
- Macro risk stayed live, U.S. inflation data and the Fed meeting remain in focus
Darkfost’s CryptoQuant-based sentiment measure briefly climbed above 89 before easing back. He described that zone as “extreme greed” and said it was the highest reading since March 2024.
That kind of reading is worth watching because extreme optimism often shows up near turning points. Not because sentiment alone predicts a top, but because markets tend to get sloppy when traders start acting like risk has been politely shown the door.
Bitcoin’s price action did not exactly scream breakout. CoinGecko showed BTC near $77, 300, with a 24-hour range of roughly $76, 393 to $79, 607. That leaves price stuck in a tight zone instead of pushing into something cleaner and more convincing.
There’s also a separate sentiment gauge that deserves to stay separate. Alternative.me’s Fear & Greed Index stood at 63, up from 56 the day before, but below 73 a week earlier and well above 29 a month earlier.
That matters because Darkfost’s reading and the Alternative.me index are not the same thing. They track different inputs, so one hot number does not “confirm” the other. Crypto has enough confusion without people smashing two unrelated gauges together and calling it analysis.
The bigger caution flag came from the money trail. According to Farside data cited by crypto.news, U.S.-listed spot Bitcoin ETFs recorded $462.7 million in net outflows during the Sep. 8-11 trading week. The largest single-day withdrawal was $282.7 million on Thursday, followed by a still-negative $13.2 million outflow on Friday.
Among individual funds, ARK 21Shares’ ARKB posted the largest weekly outflow at $234.2 million. BlackRock’s IBIT, the largest U.S. spot Bitcoin exchange-traded fund by assets, still saw a net outflow of $52.5 million across the four reported sessions.
That does not mean institutional demand vanished. It does mean the bid through ETF products was weaker than it had been just a week earlier. Another report cited by crypto.news said U.S. spot Bitcoin ETFs took in about $986.9 million during the previous trading week, bringing three weeks of inflows to roughly $3.8 billion. Against that backdrop, the shift to outflows looks more like a real turn in tone than random noise.
Jeff Ko, chief analyst at CoinEx, framed the price structure as a battle zone. In a Sep. 7 report, he said support sat around $78, 000 to $79, 000 and resistance, or a cap, was near $82, 000. He also said he wanted to see further inflows while Bitcoin traded sideways before calling it sustained accumulation.
That is the kind of sober framing markets need more of. Price can drift higher on enthusiasm alone for a while, but it takes real buying to make a move stick. Otherwise you get a crowd of very confident people standing on a slippery floor.
A separate technical report on Sep. 10 said Bitcoin fell below $78, 000 and pointed to Bollinger Band levels near $76, 392 on the lower band, $78, 650 at the midpoint, and $80, 907 at the upper band. Bollinger Bands are a volatility tool built around a moving average, and traders use them to judge whether price is stretched or compressed.
In plain English, the setup looked fragile rather than explosive. Bitcoin was still moving inside a range, but the range was starting to look less like a launchpad and more like a test of how much buyers actually wanted it.
The macro backdrop adds another layer. The U.S. Bureau of Labor Statistics said prices rose 3.4% over the 12 months through August in the latest consumer price report, released Sep. 11. Prices excluding food and energy rose 0.3% in August and 2.4% from a year earlier.
That is still above the Federal Reserve’s 2% inflation target, which keeps interest-rate expectations and liquidity conditions in play. The next Fed policy meeting is set for Sep. 15-16, and markets will be watching it closely.
Bitcoin has often traded like a liquidity-sensitive risk asset, especially when rate expectations are shifting. That does not mean the Fed decides the chart by itself. It does mean macro data can either feed a rally or take some of the air out of one, depending on how traders read it.
The cleanest read here is simple: bullish sentiment is still present, but the follow-through is weak. A hot sentiment reading, softer ETF flows, price sitting below nearby resistance, and inflation still running above target all point to a market that has not made up its mind.
That is not a death sentence for the trend. It is a warning to stop pretending the path higher is automatic. Bitcoin may still hold the range and push again if inflows return and buyers defend support. Or it may keep drifting lower if enthusiasm keeps outrunning capital. Markets have a nasty habit of humiliating people who confuse loud conviction with actual demand.
Key takeaways
-
Why does a sentiment reading above 89 matter?
It signals unusually aggressive bullish behavior. Extreme greed can appear near local tops, but it does not prove a reversal has started. -
Are Darkfost’s sentiment reading and Alternative.me’s Fear & Greed Index the same?
No. They are separate gauges with different inputs, so they should not be treated as interchangeable. -
What do the ETF outflows tell us?
U.S. spot Bitcoin ETFs saw weaker demand during the Sep. 8-11 week, which undercuts the hotter sentiment reading and suggests buyers were less committed. -
Is Bitcoin’s support around $78, 000 still important?
It was an important area in earlier analysis, but Bitcoin later slipped below it, so that zone looks more like a battleground than a guaranteed floor. -
What could move Bitcoin next?
The Fed meeting, inflation expectations, and whether ETF inflows return will matter. If capital comes back and price holds, the bullish case improves; if not, the market may keep chopping or weaken further. -
Why do sentiment gauges matter at all?
They help show when traders are becoming too optimistic or too fearful. Used properly, they can be a useful contrarian check against crowd hype and panic.
Further reading
A few extra angles on Bitcoin sentiment, macro pressure, and the broader market backdrop: