
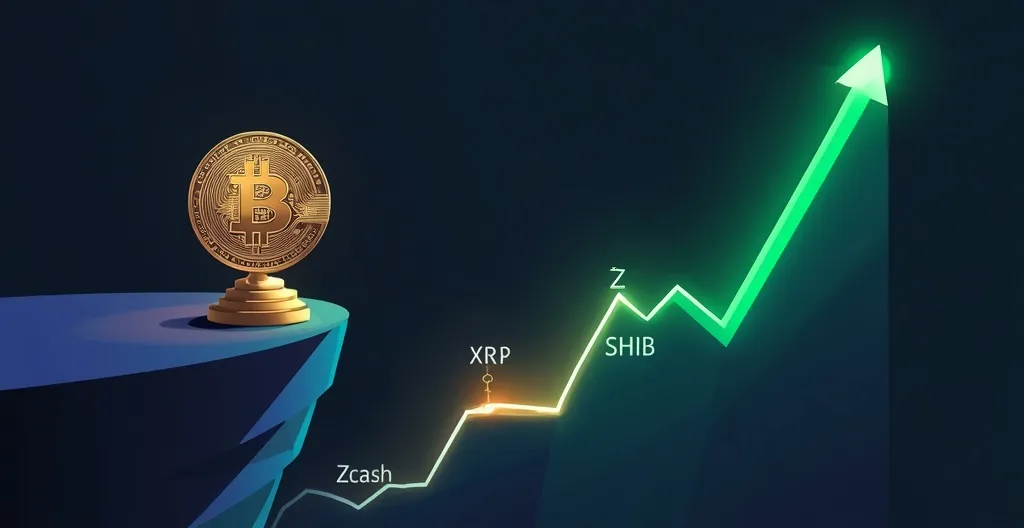
Bitcoin is still boxed in, XRP is clinging to a round-number floor, SHIB is stuck near its lows, and Zcash is the one chart that still has some backbone. According to the August 18 technical snapshot, the market is active, but not evenly strong.
- XRP: hovering near $1.00, with that level acting like a make-or-break line
- Bitcoin: stabilizing in the low $63, 000s, but not yet in a confirmed reversal
- SHIB: stuck near the lower end of its range, with weak momentum
- ZEC: the strongest-looking setup here, though still facing overhead resistance
XRP is sitting on one of the more sensitive levels on the board: the $1.00 psychological line. The token was trading close to $1.002 after briefly slipping below the round number, and that matters because daily closes below a level carry more weight than a quick intraday wick. A brief dip is noise. A daily close below support is where traders start sweating through their shirts.
The chart picture is still shaky. XRP is below its short-term average near $1.04, with longer-term averages around $1.16 and $1.35 still overhead. The next significant dynamic resistance is around $1.08. In plain English, buyers have not yet wrestled back control of the trend.
The bearish case is straightforward: if XRP loses $1.00 on a daily closing basis, there is very little obvious support below until around $0.95. The bullish case is just as simple, but harder to achieve. Buyers need to turn the $1.00 defense into a higher-low structure, which means each pullback holds above the last one instead of breaking down again. That is the difference between a base and a busted floor.
That is why the current level is being described as one of XRP’s “most technically sensitive” levels of 2026. It is not just about a number on a chart. It is about whether market participants are willing to keep defending a line that has already been tested.
Bitcoin looks steadier, but “steadier” is not the same thing as “fixed.” BTC was trading around $63, 650 and has spent most of August consolidating after a sharp June sell-off and a recovery from below $60, 000. Right now, the market is stuck in a tug-of-war between roughly $63, 000 and $64, 000.
The short-term moving averages are sitting in that same zone, which means price is fighting with nearby trend references instead of gliding above them. That is not a clean bullish setup. It is a pause.
The real test is higher up. Bitcoin remains below its declining intermediate moving average at $66, 300, and that is the first meaningful level bulls need to reclaim. A move above it would be the first significant bullish signal and could open a path toward $70, 000 and then the long-term average around $71, 600. Until that happens, Bitcoin’s structure is better described as stabilization than reversal.
That distinction matters. A market can stop falling without actually turning bullish. Traders love to confuse those two because hope is cheaper than patience.
SHIB is doing what SHIB often does when momentum dries up: drifting near the lower edge of its range and waiting for a reason to move. It was consolidating around $0.00000447, still near the bottom of its 2026 range, with short-term averages clustered around $0.00000447 to $0.00000457. The intermediate moving average sits near $0.00000490, and the long-term average is around $0.00000577.
The key zone is $0.0000049 to $0.0000050. Bulls need to reclaim that area first before the chart starts looking healthier. The RSI, a momentum indicator that helps show whether an asset is stretched or weak, was around 46. That is neither oversold nor convincing. Translation: SHIB is weak, but not yet washed out enough to scream reversal.
Immediate support sits around $0.0000043 to $0.0000044. If that gives way, the next downside target is $0.0000040, with the July lows around $0.0000041 also in play. A sustained push above $0.0000050 would reopen the $0.0000055 to $0.0000058 region, which SHIB briefly reached during a late-July volatility spike. Until then, it remains a coin stuck in the basement, not a breakout candidate.
Zcash stands out because it is the only one here that still looks structurally constructive. ZEC gained about 5% on the latest daily candle and was trading around $511, above all major moving averages. The recovery structure that started from the March-April bottom is still intact, which gives it a better technical profile than the others in this group.
For newer readers: Zcash is a privacy-focused cryptocurrency. That matters because privacy coins can trade differently from large-cap assets like Bitcoin. They often move on sector rotation, thinner liquidity, and narrative bursts rather than broad market conviction. That can create strong upside, but it can also mean sharper reversals when the crowd leaves the room.
ZEC’s immediate battleground is around $490 to $500, where the short-term moving averages are clustered near $493 to $495. Price has repeatedly traded in that region since late July. The next resistance zone is around $520 to $530, and a breakout there could shift attention toward $550 to $570. If ZEC drops below $490, the next support is around $470 to $475. Below that, $425 to $430 becomes the main structural floor, with the long-term moving average close to $426 and still rising.
That makes ZEC technically stronger, but not invincible. Strong charts can fail fast when volume dries up or the broader market rolls over. Crypto has a nasty habit of reminding everyone that “resistance” is only a polite way of saying “where sellers are waiting to ruin the mood.”
The bigger takeaway across all four names is simple: the market is not moving with one clean direction. XRP is fragile near a psychological line. Bitcoin is still waiting for confirmation. SHIB is boxed in near its lows. Zcash has relative strength, but still needs to break resistance before anyone starts writing victory speeches.
Technical levels are not magic. They are just places where enough traders are watching the same tape that their decisions start to matter. That is why support, resistance, and moving averages keep showing up in crypto analysis: not because they are sacred, but because they are crowded. And crowded levels tend to get violent when they break.
Key questions and takeaways
-
Why is $1.00 such a big line for XRP?
Because it is both a psychological level and a technical floor. If XRP closes below it on a daily basis, the chart leaves very little obvious support until around $0.95. For context on the asset’s structure, see the XRP Ledger. -
What would make Bitcoin look more bullish?
A move above $66, 300 would be the first real sign of a recovery. Until then, BTC is still just consolidating below a key trend level. A broader view of the trend can be useful in pieces like Bitcoin Hits $100, 000: Analyzing Impacts on BTC, XRP, and SHIB. -
Is SHIB showing real strength yet?
Not really. SHIB needs to reclaim $0.0000049 and then $0.0000050 before the chart starts looking like a meaningful rebound instead of a weak bounce. -
Why does ZEC look better than the others?
ZEC is trading above its major moving averages and has kept its broader recovery structure intact since the March-April bottom. That gives it cleaner technical shape than XRP, BTC, or SHIB in this setup. For a deeper price outlook, there’s also Zcash Price Prediction 2026: How High Can ZEC Go?. -
Do moving averages still matter in crypto?
Yes, especially when the market is undecided. They help show where buyers and sellers are likely to defend, and where a breakdown can turn into a real trend move. If you want the old-school framework behind that idea, moving averages are still a decent place to start.
If XRP’s setup feels familiar, that is because it often is. The token has been pinned between regulation drama and trader optimism for years, which is why market structure matters so much when price approaches key levels. A closer look at XRP faces regulatory uncertainty as it trades near 52-week highs can help explain why sentiment around it stays so twitchy.
Bitcoin, meanwhile, has been doing what Bitcoin does best: making everyone argue over whether a consolidation is healthy accumulation or just a fancy word for indecision. The range-bound grind is why traders keep circling levels like $63, 000, $64, 000, and $66, 300, and why posts such as Bitcoin consolidates within tight range, live levels to watch keep finding an audience.
That same debate shows up in the broader market, too. When one asset starts leading and others lag, traders rush to find the narrative that fits the tape after the fact, the oldest trick in the crypto book, right next to pretending a 40% drawdown was “healthy volatility.” The Uptober Rally angle is a good example of how quickly sentiment can flip once the trend gets moving.
And when the market starts rotating hard, the risk side matters just as much as the upside fantasy. A move in one direction can quickly expose weakness elsewhere, which is exactly why alerts like Bitcoin Dip Risks Emerge as Zcash Surges, XRP Stalls, and still matter for anyone trying to read the room instead of just cheerlead a bag.
Finally, it is worth remembering that fast-moving price action can be messy, and not every page that claims to explain it is worth your time. Sometimes even a broken result is a reminder to question the narrative before the trade, especially when the market is throwing mixed signals and the volume is doing the crypto equivalent of shrugging.
Further reading
A useful side note for readers who want the source trail on that ZEC chart glitch and related context: